
Cyber risk in healthcare can disrupt care, delay treatment, and put patients at risk. So if I’m setting risk scoring benchmarks, I need a system that is consistent, tied to patient safety, and checked against peer data.
Here’s the short version:
- I map scoring to NIST CSF 2.0, HICP, and HPH CPGs
- I use one scoring scale and fixed risk tiers
- I set hard minimum thresholds for direct-care systems
- I split benchmarks by medical devices, PHI systems, and clinical apps
- I calibrate scores with peer data
- I include downtime, recovery, and incident KPIs
- I test automated scoring against actual incidents and error data
- I keep third-party, supply chain, and enterprise benchmarks separate
The data makes the case. In 2024, ransomware affected 69% of U.S. patients. In 2023, healthcare breaches hit nearly 122 million people, with average breach costs near $11 million. And one study found in-hospital mortality went up 33% during ransomware incidents.
That means a raw score isn’t enough. A useful benchmark tells me what score means, what action it triggers, and whether it reflects care risk in the first place.
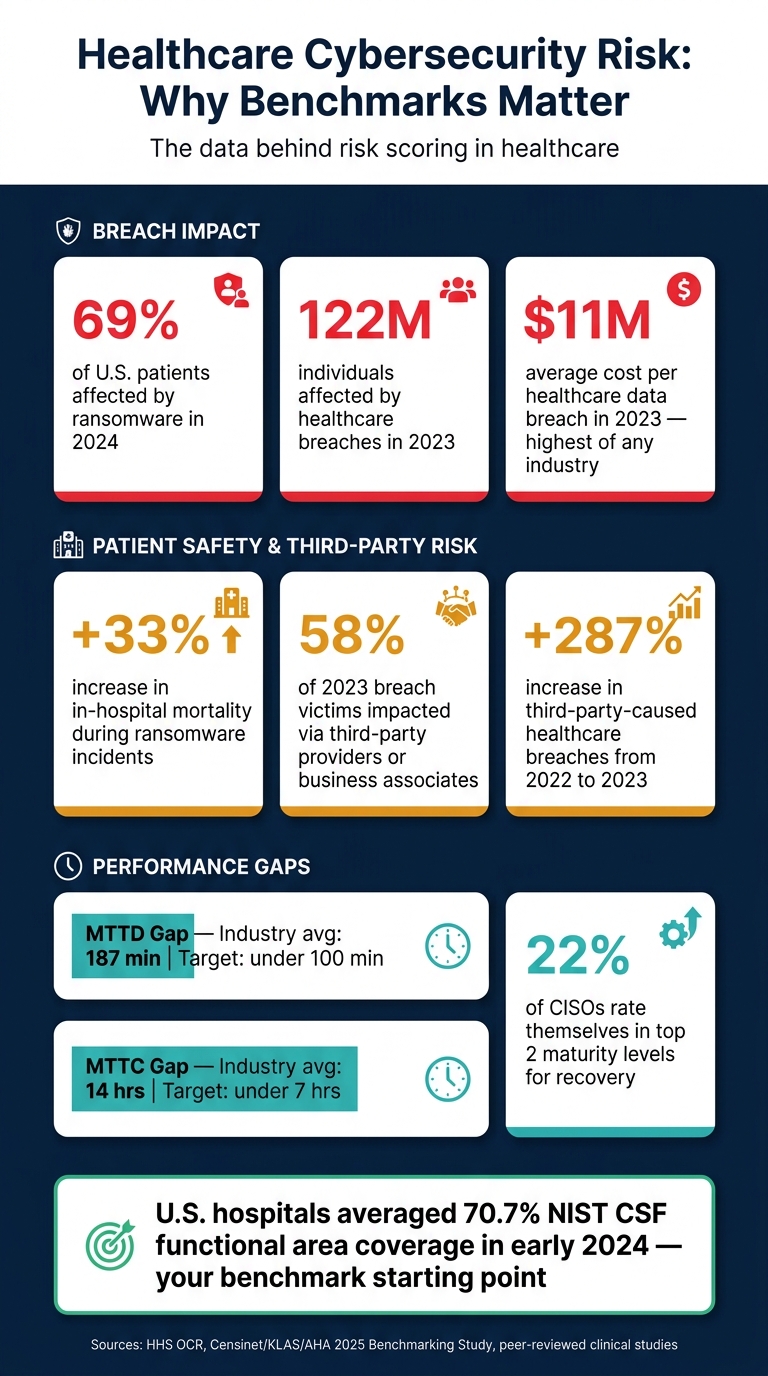
Healthcare Cybersecurity Risk by the Numbers: Why Benchmarks Matter
How to Calculate Cyber Risk: A Practical Guide to Risk Scoring
sbb-itb-535baee
Quick Comparison
| Area | What I focus on | What the benchmark should drive |
|---|---|---|
| Framework alignment | NIST CSF 2.0, HICP, HPH CPGs | Common scoring rules |
| Risk scale | One 1–5 model with fixed tiers | Same meaning across teams |
| Patient-care systems | Non-negotiable minimum thresholds | Remediation before use or continued use |
| Medical devices | Safety impact, exposure, patch limits | Device-specific scoring |
| PHI systems | Access, encryption, logging, recovery | Data protection and outage control |
| Clinical apps | Downtime, integrations, recovery time | Care continuity |
| Peer calibration | Like-for-like health system comparisons | Better score thresholds |
| KPI inputs | MTTD, MTTC, downtime, restore success | Scores tied to performance |
| Model validation | Incident history, false negatives, drift | Better scoring accuracy |
| Risk domains | Third-party, supply chain, enterprise | Separate benchmark tracks |
If I want benchmarks that hold up under review, I can’t treat every asset, vendor, or system the same. I need scoring rules that connect cyber risk to patient care, service interruption, and day-to-day decisions.
Why Risk Scoring Benchmarks Matter in Healthcare
A raw score tells you how your own controls performed. A benchmarked score adds the part most teams care about: how you stack up against similar organizations. That only works if the score is tied to the right peer group and clear benchmark rules.
The stakes are hard to ignore. In 2023, 548 healthcare data breaches were reported to HHS OCR, affecting nearly 122 million individuals [12]. Healthcare also had the highest average breach cost of any industry that year, at around $11 million per breach [12][13][14]. And a big share of that risk came from outside the organization. 58% of the 77.3 million individuals affected by healthcare breaches in 2023 were impacted through an attack on a third-party provider or business associate, a 287% increase from 2022 [10][11].
That matters because not all risk comes from the same place. A hospital can have one set of issues with enterprise systems, another with vendors, and a very different set with connected medical devices. If all of that gets rolled into one benchmark, the result can blur the problem instead of clarifying it.
Peer data shows the same pattern. Across organizations measured against NIST CSF and HICP, supply chain risk management and asset management sit among the lowest-performing categories, and medical device security ranks lowest across all ten HICP practice areas [7][8]. That’s a strong signal that one benchmark can’t cover every asset type well.
Medical device risk needs its own lens because it’s not just about data loss. It can affect uptime and patient safety too. Recovery is another weak spot. Only 22% of surveyed CISOs place themselves in the top two maturity levels for recovery [9], which shows how hard it can be to get care back on track after an incident.
A bottom-20% PHI score is much more useful than a raw score by itself. It gives teams a plain-English way to spot urgency and direct remediation where it will matter most. From there, the job becomes setting the benchmark inputs, thresholds, and peer groups that keep those comparisons consistent.
What Strong Healthcare Benchmarks Should Include
Once you've covered why benchmarks matter, the next step is figuring out what they should measure. A strong healthcare benchmark needs one scoring model, clear tier definitions, and a set review rhythm. Those pieces should help people make decisions day to day, not just fill out compliance paperwork.
The scoring scale needs to stay uniform across the organization. Each tier should be defined by likelihood, impact, and response time. For example, a score of 9–10 should trigger immediate escalation, while 4–6 should trigger a dated remediation plan. Those rules carry more weight when they're checked against peer performance.
Peer data helps teams line up internal scores with sector performance and set thresholds that make sense. In early 2024, U.S. hospitals averaged about 70.7% NIST CSF functional area coverage [18]. That gives security and risk teams a concrete reference point for where the sector stands. Industry benchmarking data also shows that average mean time to detect (MTTD) across healthcare is 187 minutes, compared with a framework-aligned target of under 100 minutes. Average mean time to contain (MTTC) is 14 hours, while the target is 7 hours or less [16].
Numbers alone aren't enough. The benchmark model also needs documented governance so it stays reliable over time. That means spelling out ownership, approvals, exception handling, and annual review cycles. Benchmarks should be reviewed at least once a year, and right away when something major changes, like a new EHR module, a new class of connected devices, or a major vendor relationship.
A good benchmark should guide clinical, operational, and vendor decisions. Next, anchor those benchmarks to recognized healthcare frameworks.
1. Align Benchmarks to NIST CSF 2.0, HICP, and HPH CPGs
Start by tying benchmarks to recognized frameworks. That gives each benchmark a clear reference point, so a score means the same thing across domains instead of just listing what each framework includes.
NIST CSF 2.0 defines six core functions. HICP lays out 10 healthcare practices and includes implementation guidance based on organization size. HPH CPGs set Essential and Enhanced baseline targets. [22][19][6][25][21] HHS also maps HPH CPGs to NIST CSF outcomes and NIST SP 800-53 Rev. 5 controls, which makes the frameworks line up well. [23]
A simple way to do this is to take one domain, like vulnerability management, and map NIST CSF outcomes, HICP practices, and HPH CPG targets to a single score. [23] That turns a score into something concrete. For example, a 2 may show partial HICP alignment and failure to meet Essential CPGs. A 4 may show full Essential CPG alignment and partial Enhanced CPG alignment. [21][23][24][25]
That kind of scoring helps teams prioritize in a repeatable way across hospitals, third-party vendors, and clinical systems. It also makes internal and external comparisons easier to defend because everyone is working from the same reference point. [22][23][24][25]
With that foundation in place, the next step is to standardize scores and tier labels.
2. Standardize Numeric Risk Scores and Tier Definitions
Once your cybersecurity benchmarks are tied to a framework, the next move is simple: make sure every team reads the score the same way.
If that doesn’t happen, "High" starts to mean different things to different groups. One team may treat it like an urgent patient safety issue. Another may see it as something that can wait until next quarter. That gap can lead to wasted effort, poor prioritization, and slower remediation.
Use one 1–5 scale across teams, vendors, and asset types. Each score should have a written definition based on observable criteria, not just a label. That applies whether you use the scale for likelihood, impact, or overall risk.
For example:
a 5 on an impact scale could mean "system-wide outage, large-scale PHI exposure, or confirmed patient harm", while a 1 means "no patient impact and no PHI involved."
That kind of shared scoring system makes your benchmark thresholds easier to defend across clinical, vendor, and operational risk decisions.
Pair the numeric scale with clearly defined risk tiers - Low, Moderate, High, and Critical. Each tier should map to a score range and a required action:
| Tier | Score Range | Required Action |
|---|---|---|
| Low | 1.0–1.9 | Monitor; review annually |
| Moderate | 2.0–2.9 | Remediate within 90 days |
| High | 3.0–3.9 | Remediation plan within 30 days; escalate to leadership |
| Critical | 4.0–5.0 | Immediate mitigation or compensating controls before go-live or continued use |
Keep risk severity tiers separate from governance maturity tiers.[26][27] If you mix them, you end up comparing different things.
Standardized tiers set the floor for the next step: minimum thresholds tied to patient safety.
3. Set Minimum Risk Thresholds Tied to Patient Safety
Once your tiers are in place, set a non-waivable minimum risk floor for direct-care systems.
Here’s the plain-English version: if a system helps clinicians diagnose, treat, or monitor patients, it should never drop below an acceptable risk level unless the issue is fixed or there are approved compensating controls in place. That includes EHRs, PACS, infusion pumps, and ventilators.
This isn’t just a policy exercise. The patient harm is well documented. One analysis found that in-hospital mortality increased by 33% during ransomware incidents, which matched an estimated 42–67 preventable deaths over five years [29][5]. A review of more than 80,000 patient safety event reports found 76 tied to EHR downtime, with 48% involving lab results and 14% involving medications [28]. Those numbers make the case for a hard floor.
The most workable approach is to create automatic risk triggers for patient-care assets. If any of the conditions below are present, the asset should be marked noncompliant until the issue is fixed and sent to remediation before deployment or continued use:
- Unpatched, remotely exploitable vulnerabilities on a clinical system with no vendor-provided mitigation
- No tested downtime procedures for systems that support order entry, medication administration, or vital sign monitoring
- Missing multifactor authentication for remote access to systems handling PHI or clinical orders
- Single points of failure in infrastructure supporting critical clinical applications, with no redundancy or failover
One team shouldn’t make these calls on its own. IT, by itself, shouldn’t set the thresholds. A clinical-cyber risk committee led by the CISO, CMO, CNO, biomedical engineering, and patient safety leaders should approve both thresholds and exceptions.
When an exception is granted, it should be handled with care:
- Clinical leadership should co-sign it
- It should be documented as temporary
- It should include a time-bound remediation plan
NIST CSF 2.0 and HHS Cybersecurity Performance Goals support folding cybersecurity risk into enterprise risk management. In healthcare, that means connecting cyber risk straight to patient safety outcomes. The floor should also vary by asset class. Medical devices, PHI systems, and clinical applications do not carry the same level of tolerance, so they shouldn’t be treated the same way.
4. Build Separate Benchmark Profiles for Medical Devices, PHI Systems, and Clinical Applications
After you set a minimum patient-safety floor, the next step is to split benchmarks by asset class. One score can't reflect the very different risk profiles of medical devices, PHI systems, and clinical applications.
These systems break in different ways, and the harm looks different too. A cohort study of 374 ransomware attacks found that 44.4% disrupted care operations [3]. That alone makes the point: a benchmark for a bedside device shouldn't look like a benchmark for an EHR-connected app or a PHI repository.
| Asset Type | Primary Risk Driver | Key Benchmark Focus | Example Failure Mode |
|---|---|---|---|
| Medical devices | Patient safety / physical harm | Device criticality, exploitability, patchability, network exposure, SBOM availability, compensating controls | Inappropriate therapy or misdiagnosis |
| PHI systems | Confidentiality, integrity, and availability of ePHI | Access control, encryption, audit logging, backup and recovery, incident response | Breach, ransomware, unauthorized disclosure |
| Clinical applications | Care-delivery continuity and data integrity | Downtime tolerance, integration dependencies, identity/access, error recovery, workflow resilience | Delayed orders, cancellations, operational disruption |
For medical devices, the main issue is patient harm. FDA guidance says manufacturers must address postmarket security flaws, provide patches, and make available a software bill of materials (SBOM) [31][30]. So the benchmark should score devices based on patient safety impact, network exposure, patchability, and whether compensating controls, such as network segmentation, are in place when patching isn't possible. A heart monitor and a low-risk support device should not sit under the same threshold. Criticality has to matter.
PHI systems need a confidentiality-first benchmark. The numbers are hard to ignore. PHI breach volume climbed from 6 million records in 2010 to 170 million in 2024, and hacking or IT incidents accounted for 91% of affected records that year [4]. In plain terms, if access control is weak, the damage can spread fast. That benchmark should put more weight on MFA coverage, encryption at rest and in transit, audit logging, and breach containment capabilities.
For clinical applications, the biggest danger is workflow disruption. If the app goes down, care can slow down with it. That's why the benchmark should focus on availability, tested downtime procedures, integration security, and recovery time objectives (RTOs). An application with slow recovery times should be treated as high risk even if its encryption posture looks good on paper. Strong encryption doesn't help much if orders stall and staff are stuck waiting.
Ownership should follow the asset type:
- Device benchmarks belong with clinical engineering
- PHI benchmarks belong with IT security and privacy
- Application benchmarks belong with CMIOs and application owners
Those groups still need one central risk committee to keep everyone aligned with NIST CSF 2.0 and HHS 405(d) HICP guidance [2][20]. Third-party risk should be split the same way. A vendor-hosted imaging app, a cloud PHI platform, and a connected infusion device do not create the same kind of exposure, so they shouldn't be judged by the same benchmark either.
5. Use Peer Benchmarking to Calibrate Internal Risk Scores
Use peer benchmarking to check and adjust your internal risk thresholds. In plain English, peer data should help validate your scoring model. It shouldn't become a separate goal on its own.
The key is using a true like-for-like cohort. Match peers by bed count, care setting, complexity, technology footprint, and asset mix so the comparison holds up. Then look at average and median third-party scores, control maturity, and risk-tier distribution across medical devices, PHI systems, and clinical applications. You should also compare remediation speed and incident rates after normalizing for volume.
That kind of comparison gives you something concrete to work with. For example, if peers in your cohort are remediating 70%–80% of high-risk third-party findings within 90 days and your team is at 40%, that gap gives you a clear, data-backed target. It also helps to compare the thresholds peers use for high-, medium-, and low-risk classifications, such as 75+ on a 0–100 scale.
The 2025 Healthcare Cybersecurity Benchmarking Study, co-led by Censinet, KLAS Research, and the American Hospital Association, offers sector reference data and tool comparisons for calibration against recognized frameworks like NIST CSF 2.0 and HICP [1].
Once you calibrate the thresholds, lock them into governance. Document each peer-driven scoring change, along with the reason behind it and the evidence that supports it. Refresh peer benchmarking data at least once a year. You should also run an off-cycle review during major ransomware waves or sector-wide vulnerabilities, when your current thresholds may no longer match the threat landscape. Peer benchmarking should be a recurring control, not a one-and-done task.
6. Include Operational KPIs in Benchmark Design
After you calibrate benchmark scores, tie them to the outcomes leaders already watch. Pure security metrics don’t show what happens on the ground. Add operational KPIs so risk scores reflect downtime, recovery, and service disruption. That way, tier labels point to actual disruption, not just a tally of controls.
Track KPIs by asset type:
- Medical devices: unsupported OS versions, secure access control coverage, and cyber-related downtime
- Clinical systems: unplanned downtime tracked separately from planned maintenance
- Critical applications: restore success rate and time to restore against RTO, plus mean time between incidents (MTBI) [18][15]
If those KPIs slip, the score should go up.
Just as important, put operational KPIs inside the scoring formula, not only in dashboards or reports. If unplanned downtime goes past a set threshold or patch SLAs are missed, raise the score. This keeps the benchmark tied to performance signals like downtime, patch SLA misses, restore success, and RTO performance instead of theoretical exposure [32][17].
For executive audiences, translate technical KPIs into plain operating terms. Report incident frequency, MTBI, MTTR, and estimated downtime cost and overtime cost in executive summaries.
Then check those KPI-weighted scores against incident and error data.
7. Validate Automated Scoring Models With Incident and Error Data
KPI-weighted scores need to line up with what happens in day-to-day operations. If they don't, the model may look fine on paper while missing actual risk. The test is simple: does the score predict incidents, or does it only point to control gaps?
Start with 12–24 months of security incidents, PHI breaches, EHR outages, and patient safety events from your SIEM, IT service management system, and compliance logs. Match each event to the right asset or vendor ID. Then compare the incident history with the score that came before it. If a high-severity incident happens after a moderate score, the model is underweighting the controls that failed.[33]
You also need to check the other side of the equation. Lower scores should line up with lower incident rates. If they don't, the benchmark is off. In a longitudinal study of 3,528 hospital-year observations, hospitals in the lowest security bands had annual breach probabilities of 38.3%–49.4%.[34] That's the kind of correlation a calibrated benchmark should show.
Track false positives and false negatives as separate error classes. False negatives matter more in a clinical setting because they can leave a high-risk asset looking safe. And when analysts override an automated score, require a written reason every time. Those override logs often tell you where the model keeps missing the mark.[33]
| Error Type | What It Signals | Correction Action |
|---|---|---|
| False Negative | Model missed a genuinely high-risk asset | Identify missing data inputs; increase weighting for relevant controls |
| False Positive | Model over-flags low-risk assets | Refine asset criticality definitions; reduce weight of low-impact indicators |
| Score Drift | Scores no longer reflect the current threat environment | Recalibrate against recent incidents; account for new asset types or threat vectors |
| Data Decay | Scores based on stale or incomplete asset data | Automate data refreshes; integrate real-time telemetry sources |
Run this validation cycle at least quarterly. Do it more often after a major incident or a major change in your environment, such as a new medical device deployment. Use NIST CSF 2.0's Improvement function to feed lessons learned back into benchmark thresholds. It also helps to review validation results separately for enterprise, third-party, and supply chain scores, since each group can fail in different ways. This is especially critical when you transform healthcare third-party risk management to ensure vendor scores remain accurate.
8. Use Separate Benchmarks for Third-Party, Supply Chain, and Enterprise Risk
Building on the asset-class split above, it also helps to separate benchmarks by risk domain, not just by system type. If you roll everything into one blended score, you can miss where the biggest exposure actually sits.
Third-party vendor benchmarks should center on patient-care impact, PHI exposure, integration depth, and outage risk. That matters because outside partners don’t all create the same kind of risk. In a 2023 medical device cybersecurity benchmarking report, manufacturers averaged 1.86 overall, while third-party entities scored 1.35, the lowest category, versus 2.48 for risk assessment. [37]
Vendor risk and supply chain risk overlap, but they shouldn’t share the same thresholds. Supply chain benchmarks need to go past a standard vendor review. For medical device manufacturers and other clinical supply partners, the benchmark should look at product security, SBOM availability, patch and firmware update processes, and support lifecycles for connected devices. It should also score concentration risk and the operational hit from a 72-hour supplier outage.
For logistics and distribution partners, score:
- Redundancy
- Cyber-BCP alignment
- Ransomware resilience
SecurityScorecard's research on U.S. healthcare supply chain cyber risk found that medical device manufacturers and medical equipment/supplies vendors scored 2–3 points lower than the overall healthcare sample on cybersecurity ratings. [36]
Enterprise benchmarks work in a different way. They measure internal control maturity across EHRs, clinical networks, data centers, and identity systems, using SIEM, scan, and CMDB data. A good way to anchor that work is with NIST CSF 2.0, HICP, and HPH CPGs across IAM, asset inventory, segmentation, incident response, and recovery. That keeps the scoring approach aligned with the rest of the benchmark design while still using domain-level inputs for internal infrastructure.
Here’s what that looks like in practice: executives might see enterprise maturity moving up while supply chain coverage of HPH CPGs stays low. That makes budget decisions a lot clearer. Censinet's Healthcare Cybersecurity Benchmarking Studies extend this model across NIST CSF 2.0, HPH CPGs, HICP, and NIST AI RMF for domain-level comparison instead of one composite score. [35]
At scale, these domain-specific benchmarks work best when scoring and updates are automated.
9. Use Censinet RiskOps to Run Benchmarking at Scale
Once you split benchmarks by asset type and risk domain, the next step is making sure teams use them the same way every time. In healthcare, benchmarks only hold up at scale when the scoring rules stay consistent across vendors, devices, and systems. Censinet RiskOps™ puts that control in one place, so scoring logic stays uniform across the full assessment program.
Teams can set different profiles for medical devices, PHI systems, and clinical applications, then apply the right threshold automatically during each assessment. New vendors and systems can inherit the right profile by default, and any threshold changes carry into future assessments that use that template. That cuts down on manual differences before a reviewer even looks at the score.
Censinet AI™ can pre-populate responses from documents such as SOC 2 reports and HITRUST certifications, then flag conflicting responses for review.
The platform also supports peer benchmarking across more than 8,000 vendors and 19,000 products [39]. That gives teams a way to compare scores by vendor category, control domain, or framework coverage. Its dashboards show benchmark adherence metrics like:
- the percentage of vendors meeting minimum thresholds
- average time to close high-severity findings
- risk tier distribution by asset class
Tower Health reported assessment completion in less than one week and 3x higher assessment productivity with two FTEs [38]. A comparison table can help teams view those profile differences side by side.
Where to Add Comparison Tables for Clarity
Once benchmark rules are set, tables make reviews much easier to move through. They help readers compare thresholds, categories, and mappings at a glance instead of hunting through paragraphs.
The four placements below keep the most important comparisons easy to scan:
- Framework-to-domain mapping table: Place it right after Section 1, with frameworks as columns and risk domains as rows.
- Risk-tier table: Add it in Section 2 so score ranges and remediation timelines are spelled out.
- Asset-weighting table: Add it in Section 4 to show why benchmarks differ across devices, PHI, and applications.
- Peer-vs-internal benchmarking snapshot table: Add it in Section 5 to show domain-level gaps.
Use the same date format under every table. Also include a last-updated date and next-review date below each one, so benchmarks stay current instead of turning stale.
Conclusion
Effective healthcare risk scoring benchmarks need to be built on purpose. That means grounding them in NIST CSF 2.0, HICP, and HPH CPGs, then tying them to clinical risk.
Those principles matter only if benchmarks stay current and stay consistent across risk domains. Strong programs keep them up to date with asset-specific thresholds, separate domain profiles, and peer calibration.
Automation is what makes scalable third-party risk management possible. But it doesn't replace judgment. Human reviewers still need to step in for exceptions and edge cases, especially when a "medium" score applies to a system that directly supports patient care. At scale, automation helps keep those rules consistent. Platforms like Censinet RiskOps™ support that balance with automated scoring, peer benchmarking, approvals, and audit logs.
The goal is a benchmark program that's accurate, defensible, and actionable. Every score should trace back to a framework. Every threshold should connect to a patient-safety or operational outcome. And every recalibration cycle should be driven by incident data and peer trends. That's the difference between benchmarks that protect patients and benchmarks that only check a box.
FAQs
How do I choose the right peer group for benchmarking?
Filter benchmarks by organizational attributes so your comparisons stay realistic and useful. Start broad, with categories like Healthcare Delivery Organizations and Health Plans.
From there, narrow your peer group with demographic and organizational details. That helps you compare cybersecurity maturity and performance against entities with similar operating profiles, not apples-to-oranges matches. Censinet RiskOps can support these tailored comparisons.
What systems need stricter minimum risk thresholds?
Systems that have a direct impact on patient safety, clinical care, or the privacy of PHI need stricter minimum risk thresholds.
That includes EHRs, medical devices, clinical workstations, lab and pharmacy systems, and telehealth endpoints. If a system could harm a patient, interrupt care, or put mission-critical operations at risk, it should fall under the highest-priority thresholds.
How often should healthcare risk benchmarks be updated?
Healthcare risk benchmarks and scores need regular updates if you want them to stay useful. A good starting point is to run a full review once a year, then check high-risk areas and critical systems every quarter.
You should also reassess right away after major trigger events, such as security incidents, EHR upgrades, mergers, acquisitions, or new regulatory guidance.
